In a peer reviewed article —
"Universal
Approach to FRAP Analysis of Arbitrary Bleaching
Patterns"
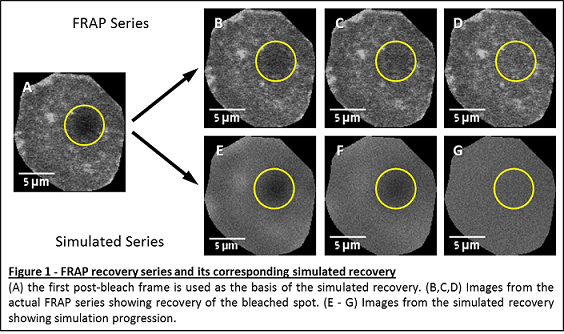
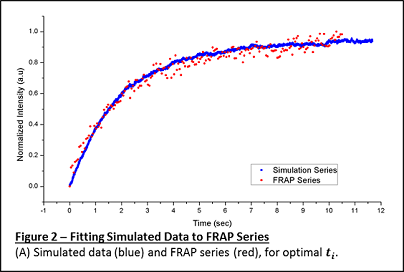
— we leveraged a computational simulation to simplify
diffusion coefficient estimate in a cell membrane (FRAP
experiments). The work also resulted in an
open
source tool for ImageJ.
M.Sc. Thesis
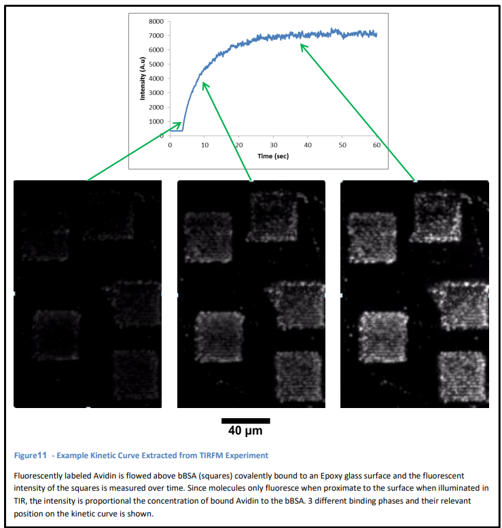
Real Time Measurement of Protein Binding for Biosensing
Applications
By leveraging Total Internal Reflection Fluorescence Microscopy
(TIRFM) we were able to measure the binding rate of a model protein
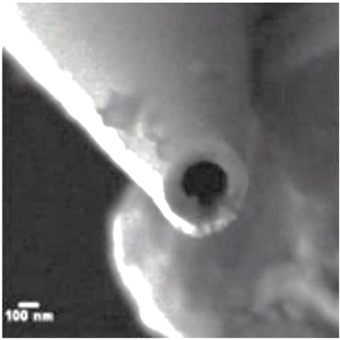
to a microfabricated binding site. Binding site was fabricated using
a Nano Fountain Pen (NFP) on treated glass slides. NFPs can
paint/print features down to the nanoscale, thus potentially
facilitating addressable, single viewfield multiplexed sensing. In
our experimental system, TIRFM lets us to reject unbound fluorescent
molecules due to rapid decay of the TIR evanescent wave.
Consequently, the brightness off the feature is proportional to the
concentration of bound analyte. Measuring the dynamics of the change
in brightness lets us directly measure the binding rate and infer
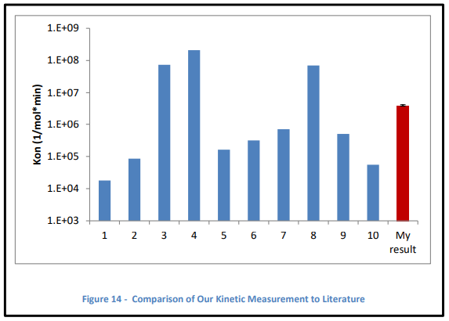
the desorption rate and binding coefficient (Kd) for the system. Our
results closely match previously reported values in the literature.
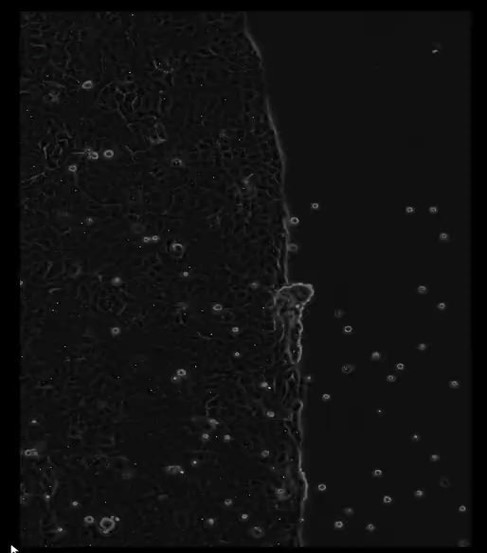
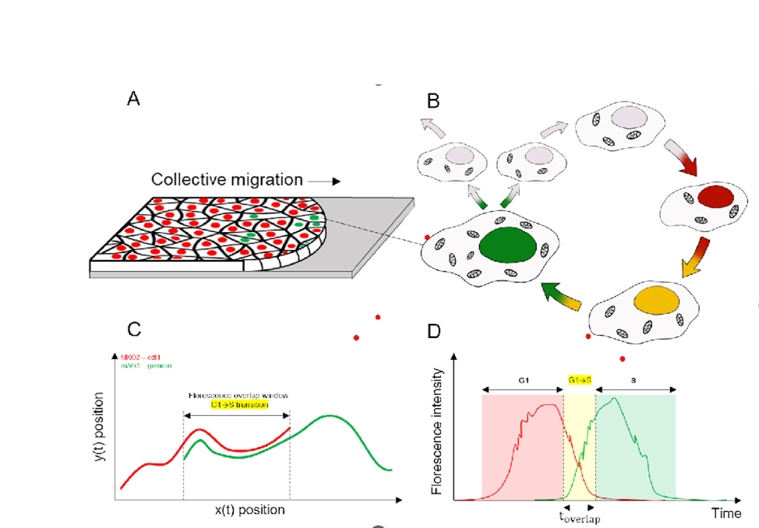
Side Project
Automated Large Scale Cell Cycle Tracking
leveraging deep learning techniques for large scale cell
segmentation and studying dynamics of near-confluent proliferating
cells. Developed a tool for streamlining analysis of FUCCI
experiments. Currently working on a manuscript for peer-review.